Draw the corresponding position-versus-time graph for the velocity-versus-time graph shown in the figure. Assume that x=0m at t=0s. (Figure 1)

Question

Draw the corresponding position-versus-time graph for the velocity-versus-time graph shown in the figure. Assume that x=0mx=0m at t=0st=0s. (Figure 1)

The plot shows the object’s velocity as a function of time. Time is measured from 0 to 12 seconds on the x-axis. The velocity is measured from -3 to 3 meters per second on the y-axis. The velocity is shown to be -3 meters per second from 0 to 4 seconds. Then the velocity jumps to 3 meters per second and stays at this value until 6 seconds. Finally, it jumps to 1 meter per second and stays the same until 12 seconds.

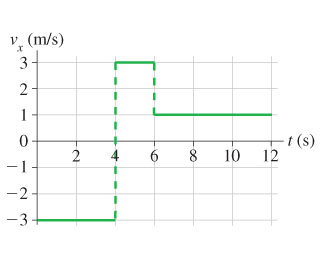
What is the object’s position at t=12st=12s?

0
General Physics Jb12 4 years 0 Answers 2186 views 0

About Jb12

Leave an answer

Browse